Originally published at: https://blog.particle.io/2019/05/03/professional-debugging-for-iot-with-particle-workbench-going-beyond-serial-print/
In the early days of the web, things were much different than today. There were no browser dev tools, not a sniff of HTML5, and JavaScript was still in its pre-AJAX infancy. Things have sure come full circle, now we all pine for a world in which on-device debugging is as easy as browser dev tools.
Fortunately, embedded debugging has gotten much better; and, with the recent launch of Particle Workbench, I’ve finally found a tool that makes hardware device debugging as easy to use as the browser dev tools. In this post, I’ll walk through how you can do the same with your Particle devices today!
TL&DR: Workbench debugging shortcuts
- A brief history of debugging
- Serial.print(), the alert() of embedded development
- Debugging with Particle Workbench
- Start a debugging session
- Setting a breakpoint
- Stepping through code
- Inspecting variables
- Watching values
- Navigating the call stack
- Advanced debugging features
Note: this post covers the basics of debugging with 3rd Generation particle devices, like the Argon, Boron, and Xenon. The Particle docs have an excellent, comprehensive guide for 3rd generation debugging, as well as a guide for debugging 2nd Generation devices (Photon, Electron).
Brief history of debugging: it’s an art
In my early development days, the state of the art in JavaScript debugging was the alert command, which would pop a UI box on ones screen with whatever value you wanted it to. Need to know the current state of a loop counter variable? alert(i); Wondering what the ADDRESS_ONE column looks like when retrieved from your SQL Server database? alert(address_one).
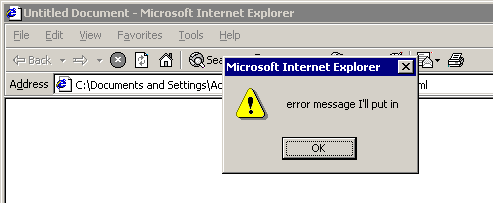
The state of the art in debugging, circa 1999.
Desperately trying to figure out where that heisenbug is in your new user auth flow that you swore to your boss up and down you tested thoroughly before deploying on a Friday at 4pm?
alert(“HERE”);alert(“HERE 2”):
alert(“WHAT ARE WEEKENDS ANYWAY? I LIVE IN THIS CUBICLE NOW.”);
In the years since, the state of debugging in the web has come a long way. With the advent of console.log(), we got the unobtrusive replacement for the alertbox. It was a move in the right direction, but still a Crocodile Dundee-sized knife when one needed a scalpel.
Then came browser developer tools, first in Firefox via Firebug, then built-in in Chrome, Firefox, IE, and Opera. Finally, web developers everywhere could set breakpoints, watches, and inspect running client-side applications like our server-focused colleagues had been doing for years.
Serial.print(), the alert() of embedded development
Many years later, I got into hardware and embedded development, and I discovered that a similar trial and error debugging process dominated the field in a way not unlike the early web. There, instead of alert() and console.log(), the tendency was to litter ones firmware with Serial.print() and Serial.println() commands as a way of logging the progress and state of an embedded application.
And much like my early use of alert(), I found myself using Serial.print() as a blunt instrument when things went awry and I had no idea where the self-induced error was to be found. Sure, professional, on-device debugging tools were available, but as a newbie in this intimidating world of hardware, I, like many others, reached for the solution that felt comfortable and familiar.
With the launch of Particle Workbench, I’m happy to report that the built-in debugging capabilities are just what we firmware developers need to go beyond Serial.print().
Debugging with Particle Workbench: Easy like the browser dev tools
Before getting started, you’ll need to gather a few materials, including:
- Particle Workbench, a new VS Code-based IDE optimized for IoT;
- One 3rd Generation Particle device. I use the Argon Kit for this post;
- One Particle Debugger;
- One USB Micro cable (included in the Argon Kit I used).
Both the Debugger and the Particle device must be connected to the same computer via USB, so make sure you have enough ports available. Connect the debugger to the debug port on your Particle device using the provided ribbon cable, and plug both into your computer. The debug port consists of ten exposed pins protected by some plastic, and you can find it next to the LiPo battery port near the top of the device.

The debugger cable plugs into the 10-pin JTAG port on the top left of the device.
Once everything is connected and powered on, you’ll need to put your Particle device into Device Firmware Update (DFU) mode. In order for Workbench to facilitate on-device debugging, it needs to compile and flash a debug build of your application and the Particle Device OS firmware in a single binary. You’ll sometimes see this referred to as a “monolithic” build because this differs from the normal build process, where Device OS and your application firmware can be updated independent of one another.
To put your device in DFU mode, press and hold the MODE and RESET buttons on the device. Then, release the RESET button, while continuing to hold the MODE button until the RGB LED on the device starts blinking yellow.
Put your device into DFU mode before starting the debug process.
Note: Step debugging 3rd generation devices with Mesh features enabled is currently unsupported due to requirements of the Nordic SoftDevice in the nrf52840. Devices in standalone mode, which is configurable during mobile setup, can be debugged with no issues.
Workbench Debugging Basics
Now that you’re setup on the hardware side, let’s start a debugging session and cover some Workbench basics. First, you’ll need to open a firmware project with Particle Workbench. I won’t cover the specifics of creating or importing projects in Workbench, so be sure to consult the docs if you need more info.
Starting a Debug Session
To start a debug session, click on the Debug icon to open the debug sidebar. Then click the debug dropdown and select the “Particle Debugger (argon, boron, xenon)” option.
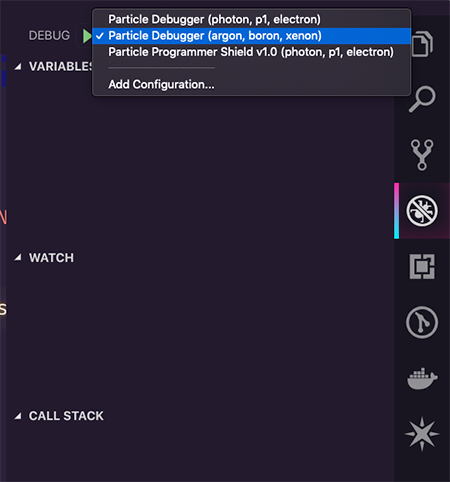
The debug sidebar icon is… a bug. Pretty easy to spot, which is more than I can say for the bugs I tend to create in my code.
Now, get ready to wait a bit as Workbench creates a debug binary for your project. This will go much faster on repeat runs, but the first run is a good time to grab a cup of coffee, take a stretch break, or practice your sword-fighting in the hallway.
Once the debug binary is built and flashed to your device, Workbench will halt and your device will power down, which you’ll see once the onboard RGB LED turns off. You’ll also see the following message in the Debug Console, which is expected.
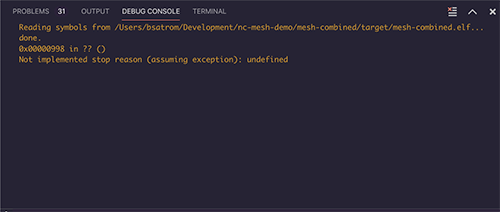
The message here is normal when starting a debug session
Click the continue button to power your device back up. Once you’re breathing cyan again, you’re ready to debug!
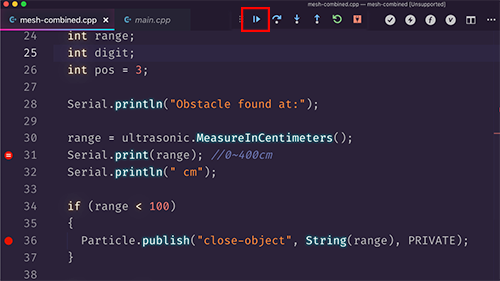
The continue button is the play button at the left of the step debugging box.
Setting Breakpoints
The first thing you’ll likely want to do is set some breakpoints so you can pause and inspect running code. You can set breakpoints by clicking in the gutter next to an individual line, or from the “Breakpoints” section of the debug sidebar. When a breakpoint is set, a red circle will appear next to the line on which to break.
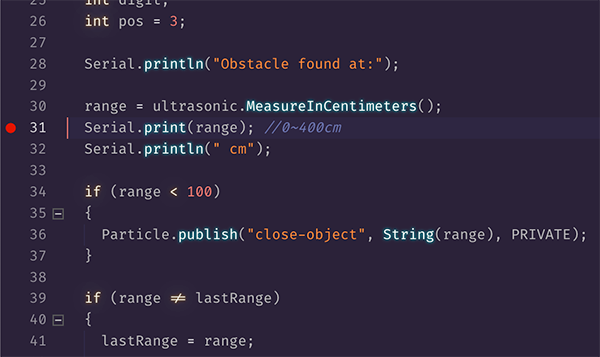
Click on the gutter next to any line to set a breakpoint
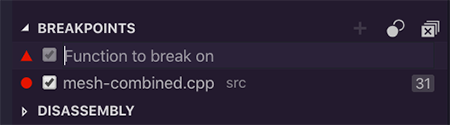
You can also add breakpoints in the sidebar by referencing a function by name
It’s also possible to set breakpoints that only break code when a condition you define is met. You can set conditional breakpoints that pause execution when a condition is true, or when a hit counter is passed. In the screenshot below, I’ve set a breakpoint to pause when an Ultrasonic distance sensor reads a value less than 100 cm.
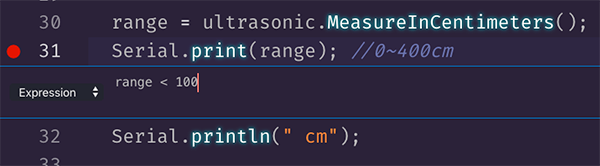
Use conditional breakpoints when you want to fine-tune how and when to break on a line of code.
Stepping through code
Once a breakpoint is hit, the line in question will be highlighted in yellow. From here, you can use the Debug menu at the top of the screen to step through your code. From left to right in the image below, those buttons allow you to continue, step over the current line, step into the current line, step out of the current scope, restart the debug session (you’ll need to put the device back in DFU mode for this to work) and finally, to disconnect the session.
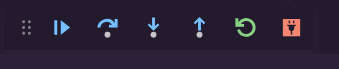
During debugging, this handy menu will appear at the top of your Workbench screen.
Hitting continue resumes execution until the next breakpoint is hit. Most of the time, you’ll end up using the step into, over and out buttons to explore your code.
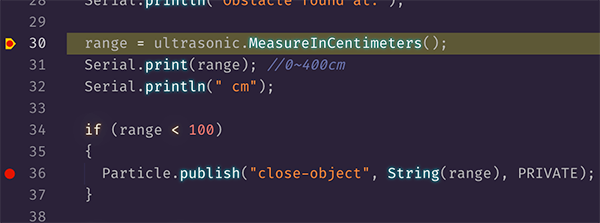
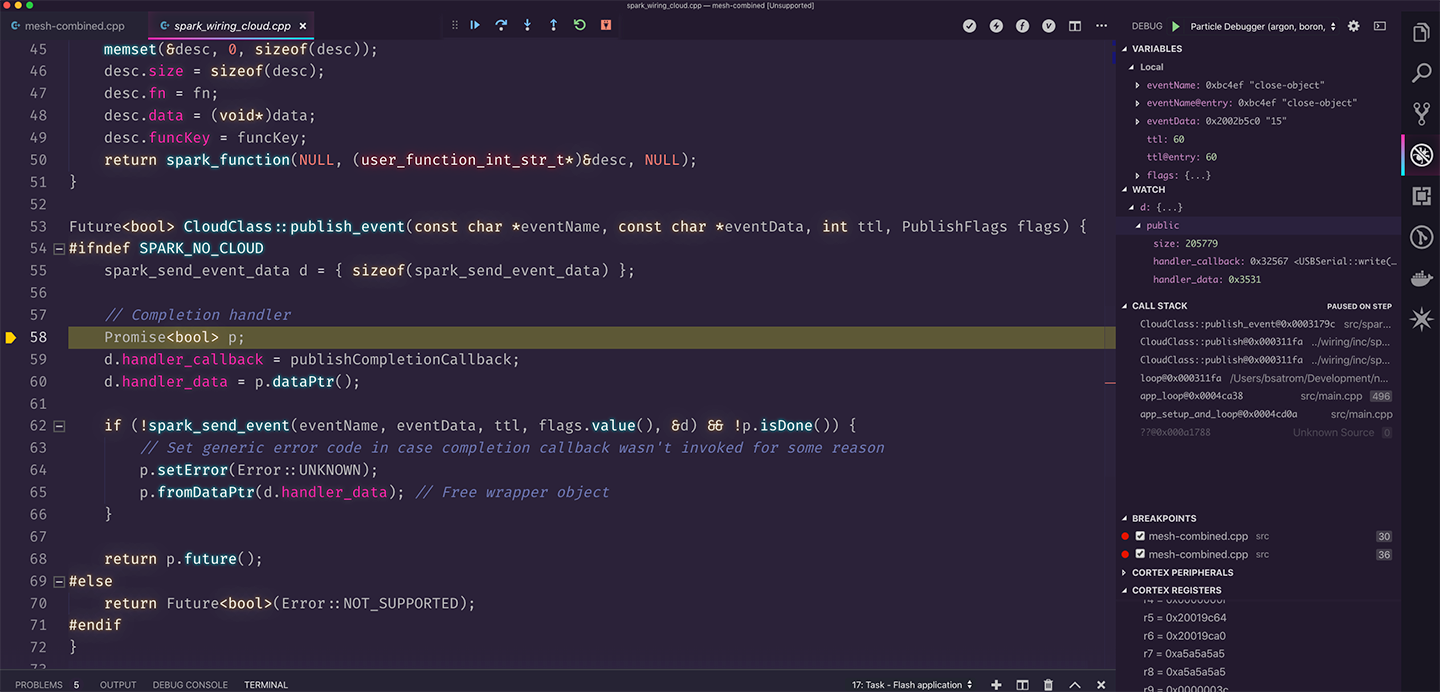
When paused on a breakpoint, the current line will be highlighted in yellow.
Let’s consider the difference between stepping over and into the following line of code.
range = ultrasonic.MeasureInCentimeters();
Clicking step over will move execution to the next line, Serial.print() and pause again. From here, you can inspect variables, the call stack, and more. If the line in question is a function, you can also step into the source of that function. This is really handy when debugging in firmware libraries, like in the case of the MeasureInCentimeters function, which is part of the Grove-Ultrasonic-Ranger library!
The debugger can step into locally-installed firmware libraries
Once inside a function, you can use the “Step Out” option to continue execution through the rest of the current function and break again on the next line after that function returns.
Step debugging allows you to inspect your code, code in firmware libraries, and even sources in the Device OS firmware! Ever wanted to explore the internals of how Particle’s brilliant firmware team implemented Particle.publish()? With Workbench debugging, you can!
 You can also step-debug into Device OS internals!
Inspecting variables
Step debugging is magical in itself, I know. Often, however, the reason we need to debug in the first place is to check the state of our application when it reaches a breakpoint. Workbench provides a number of ways for you to do this. To begin with, when paused on a breakpoint, you can hover over a variable or object and a tooltip will appear with information about its state. You can also inspect the values of local and global variables using the Variables panel.

The variables panel contains information about local, global and static state
Watching values
Beyond inspecting local and global variables, you can use the watch panel to tell the debugger to keep track of the state of a given variable or object. This can be quite useful if you want to see how a portion of your application mutates or is affected by another variable, or if you want to take a closer look at when a given variable or object comes into or goes out of scope as your app is running.
The watch panel is useful for keeping track of state while you debug
Navigating the call stack
One of my favorite debugging features is the Call Stack navigator, which can come in quite handy when you’re spelunking the internals of a library or the Device OS firmware. The pane keeps running track of the stack from your current position up, and you can click on any entry in the stack to quickly navigate to that position.

With the Call Stack panel, you can move around anywhere in the stack of the current breakpoint
Advanced Debugging Features
In addition to the features covered in this post, the Workbench debugger provides access to several debug features built-in to VS Code and leveraged by the cortex-debug extension, including the ability to inspect and edit hardware registers, peripherals, and even direct memory locations. All of these are outside of the scope of this post, so check out the docs for these tools to learn more about how to use them.
Additional Tips and Tricks
Once you’re done debugging and ready to resume normal coding and flashing, you’ll need to get your device out of its debug state, meaning that you want to replace the “monolithic” debug build with the hybrid application and device OS firmware. To do this, put the device back into DFU mode and run the “Particle: Flash application & Device OS (local)” command in the Workbench command palette.
And if you ever run into weird errors while debugging or flashing, the Workbench clean commands are your friends! In my experience, when these things pop up, running “Particle: Clean application & Device OS (local)” and “Particle: Clean application for debug (local)” are usually enough to set things right again.
Much as the web has come a long way since the early days of alert()-based debugging, the built-in debugging capabilities of Particle Workbench will enable Particle developers everywhere to peer under the covers of their embedded applications with ease and confidence. Debugging with Particle Workbench is already a game-changer for me, and I bet it will be for you too.

