We have 107 Boron 404X’s. I (so far) have one problem child. It blinks green all the time. I’ve tried using the Device Doctor to reflash and that seems to work. But it will not get past blinking green.
Hello,
What DeviceOS are you currently running? If you are not aware, there is a connectivity issue specific to BRN404X and specific Device OS versions. This is outlined in TAN012. Upgrading to Device OS 5.3.1 or 4.0.3 (when available) or later will have this issue fixed. Cheers.
Hello,
I have also been experiencing this issue over the last few days. I am using a BRN404. Here is what I have tried so far:
- The first time I plugged in the device, I followed the steps from https://setup.particle.io/, and after 30-60 minutes of green blinking, the device started breathing cyan to indicate a cellular connection, and I was able to ping the device from the dashboard.
- I tried flashing code using the Web IDE. I followed the instructions here and tried the specific example code that is referenced: Boron | Quickstart | Particle. From what I recall, I received some indication of a successful flash (I don't remember exactly what occurred, but there was a change in the LED blinking), before the board started blinking green again. I left it running for at least an hour, but the board was still blinking green rapidly. The blinking pattern did not match the duty cycle and frequency combination that was indicated in the code.
- I tried following the setup steps again (https://setup.particle.io/) to no success. These steps seem to only download firmware version 4.1.0 as a default. I let the device try to connect for at least as long as the time it took initially, but it never ended up connecting.
- Next I tried doing a Device Restore USB | Tools | Particle, which allowed me to select the version. I have tried both of the latest major releases (5.4.0, and 4.1.0) multiple times, with the same result every time (LED blinks green continuously).
Is there anything else I can try here? I am doubting that it's a cellular receptivity issue, because I was able to connect the first time I tried. Not sure if it could be a hardware issue with the cellular chip, but at the very least the nRF chip (which I assume is responsible for the USB interface) appears to be working.
Any help would be greatly appreciated.
Thanks!
Hi and welcome to the community!
What if you tried Device Doctor?
Hi @gusgonnet. Thank you for your reply! I wasn't aware of this tool.
Running Device Doctor
I tried running the Device Doctor firmware, it gave me the following information:
"It appears that your device connected to the cloud, then got a firmware update that erased the setup firmware. This prevents logs and other diagnostic data from being displayed, but your device should be fully functional."
I'm not sure what other diagnostic information would be helpful, but here is the device firmware:
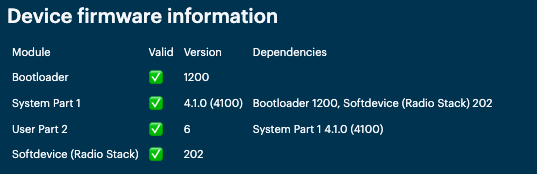
The only cellular information that is provided is the Device ID, everything else is blank.
Running Device Restore again
After running Device Doctor, the device seemed to be in DFU mode (LED blinking yellow). Without any indication of next steps in the Device Doctor tool, I just tried restoring the device again. It resumed blinking green. I just finished waiting another 60 minutes and nothing else has happened.
Any other ideas? I haven't moved it from the location it was when I first tried and successfully connected to cellular, so I am doubtful that it is a reception issue.
Thanks!
Did you add it as part of a product? If so, maybe the product firmware is overwritting the device doctor once the device gets connected to the cloud?
oh I just interpreted this. I think you didn't need to restore the device again. Instead, try device doctor again and simply reset the device.
Let's see what those logs say.
Ok, I just tried the Device Doctor again, then reset it (I reset it by holding the reset button on the board) After resetting, the LED was briefly green, then appeared to breath blue for a few seconds before resuming the rapid green blinking.
What logs are you looking for specifically?
This is what the Device Doctor shows me:

When I click 'Download Logs', it just gives me a .txt file with the exact same 'Cellular Information' that is displayed on the Device Doctor page.
There should be logs coming up in that panel. Do you have a Particle CLI running in your computer that could be impacting the logs getting to your browser?
if you have a
particle serial monitor
please stop it so the device doctor can give a verdict.
So I thought I didn't, but I tried quitting my Terminal and then re-starting Device Doctor. I am now getting logs. I tried to install the Particle CLI when I first tried bringing up my Boron, but the installation was not working (apparent compatibility issues with Apple M1 that were not resolved when I launched my Terminal with Rosetta, as suggested by what I found in the forums at the time). I guess this is a different issue that maybe I can file a ticket for elsewhere...
Anyways, here are the logs from the loop it appears to be stuck in (I redacted some of the Cellular identification information from the beginning of the file, not sure if that matters or not.):
Modem Manufacturer: u-blox
Modem Model: SARA-R410M-02B
Modem Firmware Version: L0.0.00.00.05.08 [Apr 17 2019 19:34:02]
Modem Application Version: L0.0.00.00.05.08,A.02.04
Power Supply: VIN
Battery: Unknown
Battery SoC: -1
Country:
Carrier:
Access Technology:
Band:
Cellular Global Identity:
0000000266 [system.nm] TRACE: Request to power on the interface
0000000266 [ncp.client] TRACE: Powering modem on, ncpId: 0x44
0000000267 [ncp.client] TRACE: Modem already on
0000000267 [ncp.client] TRACE: Setting UART voltage translator state 1
0000000269 [system.nm] INFO: State changed: DISABLED -> IFACE_DOWN
0000000368 [ncp.client] TRACE: Setting UART voltage translator state 0
0000000468 [ncp.client] TRACE: Setting UART voltage translator state 1
0000000468 [ncp.client] TRACE: Muxer is not currently running
0000000470 [ncp.client] TRACE: Initialized muxer @ 460800 baudrate
0000000470 [mux] INFO: Starting GSM07.10 muxer
0000000471 [mux] INFO: GSM07.10 muxer thread started
0000000475 [ncp.client] TRACE: Resumed muxed session
0000000475 [mux] INFO: Openning mux channel 1
0000000824 [mux] INFO: Closing mux channel 2
0000001178 [ncp.at] TRACE: > AT
0000001186 [ncp.at] TRACE: < OK
0000001186 [ncp.client] TRACE: NCP ready to accept AT commands
0000001187 [ncp.at] TRACE: > AT
0000001195 [ncp.at] TRACE: < OK
0000001196 [ncp.at] TRACE: > ATI9
0000001204 [ncp.at] TRACE: < L0.0.00.00.05.08,A.02.04
0000001205 [ncp.at] TRACE: < OK
0000001205 [ncp.client] TRACE: App firmware: 204
0000001206 [ncp.at] TRACE: > AT+UGPIOC?
0000001215 [ncp.at] TRACE: < +UGPIOC:
0000001215 [ncp.at] TRACE: < 7,255
0000001216 [ncp.at] TRACE: < 16,255
0000001217 [ncp.at] TRACE: < 19,255
0000001217 [ncp.at] TRACE: < 23,0
0000001218 [ncp.at] TRACE: < 24,255
0000001218 [ncp.at] TRACE: < 25,255
0000001219 [ncp.at] TRACE: < 42,255
0000001219 [ncp.at] TRACE: < OK
0000001220 [ncp.at] TRACE: > AT+UGPIOR=23
0000001228 [ncp.at] TRACE: < +UGPIOR: 23,1
0000001229 [ncp.at] TRACE: < OK
0000001229 [ncp.client] INFO: Using internal SIM card
0000001230 [ncp.at] TRACE: > AT+CPIN?
0000001238 [ncp.at] TRACE: < +CPIN: READY
0000001239 [ncp.at] TRACE: < OK
0000001240 [ncp.at] TRACE: > AT+CCID
0000001248 [ncp.at] TRACE: < +CCID: 89883070000008794552
0000001248 [ncp.at] TRACE: < OK
0000001249 [ncp.at] TRACE: > AT+IFC?
0000001257 [ncp.at] TRACE: < +IFC: 2,2
0000001257 [ncp.at] TRACE: < OK
0000001258 [ncp.at] TRACE: > AT+IFC=2,2
0000001266 [ncp.at] TRACE: < OK
0000001267 [ncp.at] TRACE: > AT
0000001274 [ncp.at] TRACE: < OK
0000001275 [ncp.at] TRACE: > AT+CCID
0000001283 [ncp.at] TRACE: < +CCID: 89883070000008794552
0000001284 [ncp.at] TRACE: < OK
0000001285 [ncp.at] TRACE: > AT+UMNOPROF?
0000001293 [ncp.at] TRACE: < +UMNOPROF: 100
0000001293 [ncp.at] TRACE: < OK
0000001294 [ncp.at] TRACE: > AT+UBANDMASK?
0000001300 [ncp.at] TRACE: < +UBANDMASK: 0,6170,1,524420
0000001301 [ncp.at] TRACE: < OK
0000001301 [ncp.at] TRACE: > AT+COPS=3,2
0000001309 [ncp.at] TRACE: < OK
0000001310 [ncp.at] TRACE: > AT+CGEREP=1,0
0000001314 [ncp.at] TRACE: < OK
0000001315 [ncp.at] TRACE: > AT+URAT?
0000001319 [ncp.at] TRACE: < +URAT: 7
0000001320 [ncp.at] TRACE: < OK
0000001320 [ncp.at] TRACE: > AT+CPSMS?
0000001329 [ncp.at] TRACE: < +CPSMS:0,,,"01100000","00000000"
0000001329 [ncp.at] TRACE: < OK
0000001330 [ncp.at] TRACE: > AT+CEDRXS?
0000001335 [ncp.at] TRACE: < +CEDRXS:
0000001335 [ncp.at] TRACE: < OK
0000001336 [mux] INFO: Mux channel 1 already opened
0000001337 [ncp.at] TRACE: > AT
0000001346 [ncp.at] TRACE: < OK
0000001347 [ncp.client] TRACE: NCP state changed: 1
0000001347 [net.pppncp] TRACE: NCP event 1
0000001350 [app] INFO: cellular is on
0000001351 [ncp.at] TRACE: > AT+CCID
0000001359 [ncp.at] TRACE: < +CCID: 89883070000008794552
0000001360 [ncp.at] TRACE: < OK
0000001362 [ncp.at] TRACE: > AT+CGMI
0000001369 [ncp.at] TRACE: < u-blox
0000001370 [ncp.at] TRACE: < OK
0000001372 [ncp.at] TRACE: > AT+CGMM
0000001379 [ncp.at] TRACE: < SARA-R410M-02B
0000001379 [ncp.at] TRACE: < OK
0000001381 [ncp.at] TRACE: > AT+CGMR
0000001388 [ncp.at] TRACE: < L0.0.00.00.05.08 [Apr 17 2019 19:34:02]
0000001389 [ncp.at] TRACE: < OK
0000001391 [ncp.at] TRACE: > AT+CGSN
0000001398 [ncp.at] TRACE: < 354724647336749
0000001399 [ncp.at] TRACE: < OK
0000001496 [app] INFO: Auto-connect disabled
0000001941 [ncp.at] TRACE: > AT+CFUN?
0000001947 [ncp.at] TRACE: < +CFUN: 1
0000001948 [ncp.at] TRACE: < OK
0000001949 [ncp.at] TRACE: > AT+CCID
0000001957 [ncp.at] TRACE: < +CCID: 89883070000008794552
0000001958 [ncp.at] TRACE: < OK
0000001958 [ncp.at] TRACE: > AT+CGSN
0000001966 [ncp.at] TRACE: < 354724647336749
0000001967 [ncp.at] TRACE: < OK
0000001968 [ncp.at] TRACE: > ATI9
0000001976 [ncp.at] TRACE: < L0.0.00.00.05.08,A.02.04
0000001976 [ncp.at] TRACE: < OK
0000002372 [system.nm] INFO: State changed: IFACE_DOWN -> IFACE_REQUEST_UP
0000002375 [net.ppp.client] TRACE: PPP thread event ADM_UP data=0
0000002375 [net.ppp.client] TRACE: State NONE -> READY
0000002377 [ncp.at] TRACE: > AT+CFUN?
0000002378 [system.nm] INFO: State changed: IFACE_REQUEST_UP -> IFACE_UP
0000002386 [ncp.at] TRACE: < +CFUN: 1
0000002386 [ncp.at] TRACE: < OK
0000002387 [ncp.at] TRACE: > AT+CGDCONT?
0000002396 [ncp.at] TRACE: < +CGDCONT: 1,"IP","gpinternet","0.0.0.0",0,0,0,0
0000002397 [ncp.at] TRACE: < OK
0000002397 [ncp.at] TRACE: > AT+CFUN?
0000002402 [ncp.at] TRACE: < +CFUN: 1
0000002402 [ncp.at] TRACE: < OK
0000002403 [ncp.at] TRACE: > AT+CEREG=2
0000002411 [ncp.at] TRACE: < OK
0000002411 [ncp.client] TRACE: NCP connection state changed: 1
0000002412 [net.pppncp] TRACE: NCP event 2
0000002412 [net.pppncp] TRACE: State changed event: 1
0000002413 [net.ppp.client] TRACE: PPP thread event LOWER_DOWN data=0
0000002414 [ncp.at] TRACE: > AT+COPS?
0000002421 [ncp.at] TRACE: < +COPS: 0
0000002421 [ncp.at] TRACE: < OK
0000002422 [ncp.at] TRACE: > AT+CEREG?
0000002430 [ncp.at] TRACE: < +CEREG: 2,2
0000002431 [ncp.at] TRACE: < OK
0000017431 [ncp.at] TRACE: > AT+CEREG?
0000017439 [ncp.at] TRACE: < +CEREG: 2,2
0000017440 [ncp.at] TRACE: < OK
0000017440 [ncp.at] TRACE: > AT+UCGED=5
0000017448 [ncp.at] TRACE: < OK
0000017449 [ncp.at] TRACE: > AT+UCGED?
0000017459 [ncp.at] TRACE: < +RSRP: 284,5060,"-073.20",276,5060,"-090.30",
0000017459 [ncp.at] TRACE: < +RSRQ: 284,5060,"-08.60",276,5060,"-20.00",
0000017460 [ncp.at] TRACE: < OK
0000032460 [ncp.at] TRACE: > AT+CEREG?
0000032468 [ncp.at] TRACE: < +CEREG: 2,2
0000032468 [ncp.at] TRACE: < OK
0000032469 [ncp.at] TRACE: > AT+UCGED=5
0000032477 [ncp.at] TRACE: < OK
0000032478 [ncp.at] TRACE: > AT+UCGED?
0000032487 [ncp.at] TRACE: < +RSRP: 284,5060,"-074.70",276,5060,"-095.50",
0000032488 [ncp.at] TRACE: < +RSRQ: 284,5060,"-09.10",276,5060,"-20.00",
0000032489 [ncp.at] TRACE: < OK
0000047489 [ncp.at] TRACE: > AT+CEREG?
0000047495 [ncp.at] TRACE: < +CEREG: 2,2
0000047495 [ncp.at] TRACE: < OK
0000047496 [ncp.at] TRACE: > AT+UCGED=5
0000047501 [ncp.at] TRACE: < OK
0000047502 [ncp.at] TRACE: > AT+UCGED?
0000047507 [ncp.at] TRACE: < +CME ERROR: unknown
0000062507 [ncp.at] TRACE: > AT+CIMI
0000062515 [ncp.at] TRACE: < 732123200904464
0000062515 [ncp.at] TRACE: < OK
0000062516 [ncp.at] TRACE: > AT+CEREG?
0000062524 [ncp.at] TRACE: < +CEREG: 2,2
0000062525 [ncp.at] TRACE: < OK
0000062526 [ncp.at] TRACE: > AT+UCGED=5
0000062533 [ncp.at] TRACE: < OK
0000062534 [ncp.at] TRACE: > AT+UCGED?
0000062544 [ncp.at] TRACE: < +RSRP: 284,5060,"-073.10",276,5060,"-085.50",
0000062544 [ncp.at] TRACE: < +RSRQ: 284,5060,"-09.00",276,5060,"-20.00",
0000062545 [ncp.at] TRACE: < OK
0000077545 [ncp.at] TRACE: > AT+CEREG?
0000077553 [ncp.at] TRACE: < +CEREG: 2,2
0000077553 [ncp.at] TRACE: < OK
0000077554 [ncp.at] TRACE: > AT+UCGED=5
0000077562 [ncp.at] TRACE: < OK
0000077563 [ncp.at] TRACE: > AT+UCGED?
0000077572 [ncp.at] TRACE: < +RSRP: 284,5060,"-073.50",276,5060,"-091.30",
0000077573 [ncp.at] TRACE: < +RSRQ: 284,5060,"-11.30",276,5060,"-20.00",
0000077574 [ncp.at] TRACE: < OK
0000092574 [ncp.at] TRACE: > AT+CEREG?
0000092582 [ncp.at] TRACE: < +CEREG: 2,2
0000092582 [ncp.at] TRACE: < OK
0000092583 [ncp.at] TRACE: > AT+UCGED=5
0000092591 [ncp.at] TRACE: < OK
0000092592 [ncp.at] TRACE: > AT+UCGED?
0000092601 [ncp.at] TRACE: < +RSRP: 284,5060,"-073.60",276,5060,"-088.70",
0000092602 [ncp.at] TRACE: < +RSRQ: 284,5060,"-09.40",276,5060,"-20.00",
0000092603 [ncp.at] TRACE: < OK
0000094303 [ncp.at] TRACE: < +CEREG: 0
0000094803 [ncp.at] TRACE: < +CEREG: 2
0000107603 [ncp.at] TRACE: > AT+CEREG?
0000107609 [ncp.at] TRACE: < +CEREG: 2,2
0000107609 [ncp.at] TRACE: < OK
0000107610 [ncp.at] TRACE: > AT+UCGED=5
0000107615 [ncp.at] TRACE: < OK
0000107615 [ncp.at] TRACE: > AT+UCGED?
0000107620 [ncp.at] TRACE: < +CME ERROR: no network service
0000110021 [ncp.at] TRACE: < +CEREG: 3
0000122521 [ncp.at] TRACE: > AT+CIMI
0000122527 [ncp.at] TRACE: < 234500011815157
0000122527 [ncp.at] TRACE: < OK
0000122628 [ncp.at] TRACE: > AT+CEREG?
0000122633 [ncp.at] TRACE: < +CEREG: 2,3
0000122634 [ncp.at] TRACE: < OK
0000122635 [ncp.at] TRACE: > AT+UCGED=5
0000122639 [ncp.at] TRACE: < OK
0000122640 [ncp.at] TRACE: > AT+UCGED?
0000122645 [ncp.at] TRACE: < +CME ERROR: unknown
0000125045 [ncp.client] TRACE: Sticky EPS denied state for 15 s, RF reset
0000125046 [ncp.at] TRACE: > AT+CFUN=0,0
0000125259 [ncp.at] TRACE: < OK
0000125260 [ncp.at] TRACE: > AT+CFUN=1,0
0000125264 [ncp.at] TRACE: < OK
0000125265 [ncp.at] TRACE: > AT+CPIN?
0000125269 [ncp.at] TRACE: < +CPIN: READY
0000125270 [ncp.at] TRACE: < OK
0000125271 [ncp.at] TRACE: > AT+CCID
0000125276 [ncp.at] TRACE: < +CCID: 89883070000008794552
0000125277 [ncp.at] TRACE: < OK
0000125278 [ncp.at] TRACE: > AT+IFC?
0000125282 [ncp.at] TRACE: < +IFC: 2,2
0000125283 [ncp.at] TRACE: < OK
0000137683 [ncp.at] TRACE: > AT+CEREG?
0000137688 [ncp.at] TRACE: < +CEREG: 2,3
0000137689 [ncp.at] TRACE: < OK
0000137690 [ncp.at] TRACE: > AT+UCGED=5
0000137694 [ncp.at] TRACE: < OK
0000137695 [ncp.at] TRACE: > AT+UCGED?
0000137699 [ncp.at] TRACE: < +CME ERROR: no network service
I do not know what could be the problem.
Inviting @Colleen or @rickkas7 to the topic to see if they have insights.
@werl
I have had this problem as well. It ended up being related to the tower my device was trying to connect to (at least for me). I drove to an area where I had a strong cell signal from a different tower and was able to get it to connect. This of course was all prior to the new OS that is supposed to solve the issue.
Thank you for the reply @jackpot. I tried plugging it in at home, which is far enough away to use a different tower, but my device still isn't connecting.
I found an Electron in my lab and was able to get that up and running (on Device OS 2.3.1), which suggests to me that there shouldn't be a cell reception issue (even though they are using different bands).
Does anyone have any other suggestions, or steps to get more help? @gusgonnet Do you know anyone else who could take a look at the logs I posted above? Any help would be much appreciated! Thanks.
This topic was automatically closed 182 days after the last reply. New replies are no longer allowed.