@no1089, @ericpietrowicz - Good news and bad news... good news is I was able to replicate it while capturing log files. Unfortunately, nothing is written out to the log when the high current scenario occurs.
Here is a video of my test setup once the scenario presents itself: Sorry for rotating the video when showing the log. I did include it farther below.
Not sure if I mentioned this, but I also was able to replicate this when the device is in a sleep with network state. When the high current state occurs, the MCU continues to sleep.
So it seems like it's something specific on the cellular modem itself and
One open question: What changed between Sept 2023 and now that also resulted in a further reduction in the steady state/connected current from ~ 9mA --> 5 mA when working correctly. Was there some additional functionality or mode we are putting the cellular modem in that was added behind the scenes at Particle in an attempt to further reduce current draw less than 9 mA? Maybe this had some sort of unintended side affect that we are just now observing?
Let me know what else you'd like me to test/try.
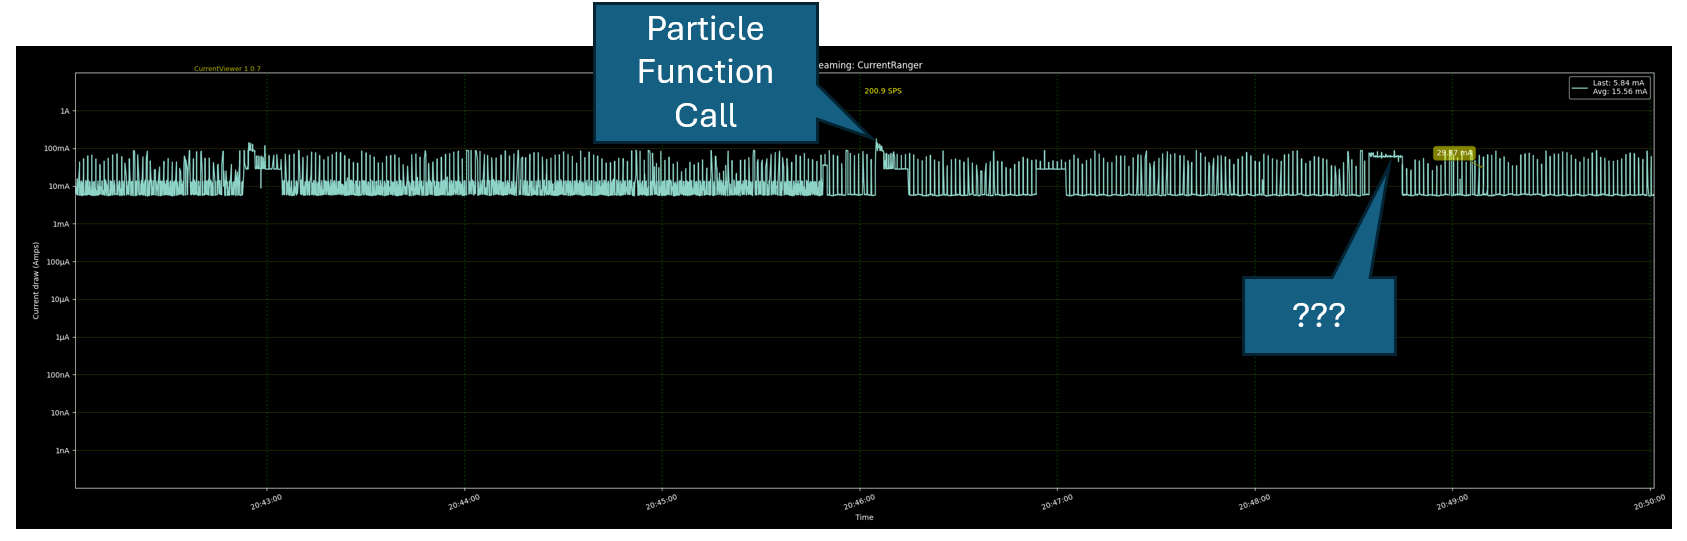
Here are further details of what's provided in the video:
Here is the snippet of the log file. The high current condition started occurring about 5 minutes after the reboot sometime between 0000020787 and 0000372541. The logging was completely silent during this time.
Notice, there is then the digitalRead command in the log at 0000372541. This aligns with me clicking the digital read function in the video.
0000020602 [ncp.at] TRACE: < OK
0000020602 [comm.coap] TRACE: Sending CoAP message
0000020603 [comm.coap] TRACE: CON 2.05 size=199 token=02 id=10
0000020786 [comm.coap] TRACE: Received CoAP message
0000020787 [comm.coap] TRACE: ACK 0.00 size=4 token= id=10
{High current scenario started during this lull period with nothing being written out to the log}
0000372540 [comm.coap] TRACE: Received CoAP message
0000372541 [comm.coap] TRACE: CON POST /f/digitalRead? size=20 token=03 id=64125
0000372541 [comm.coap] TRACE: Sending CoAP message
0000372542 [comm.coap] TRACE: ACK 0.00 size=4 token= id=64125
0000372543 [app] INFO: digitalRead command received:
0000372544 [comm.coap] TRACE: Sending CoAP message
0000372544 [comm.coap] TRACE: CON 2.04 size=10 token=03 id=11
0000372700 [comm.coap] TRACE: Received CoAP message
0000372700 [comm.coap] TRACE: ACK 0.00 size=4 token= id=11
Here is the full log file from when the device first powered up:
0000002052 [net.pppncp] TRACE: NCP event 3
0000002053 [net.pppncp] TRACE: NCP power state changed: IF_POWER_STATE_UP
0000002053 [system.nm] TRACE: Interface 4 power state changed: UP
0000002054 [ncp.client] TRACE: Modem powered on
0000002054 [ncp.client] TRACE: Setting UART voltage translator state 1
0000002154 [ncp.client] TRACE: Setting UART voltage translator state 0
0000002254 [ncp.client] TRACE: Setting UART voltage translator state 1
0000003256 [ncp.at] TRACE: > AT
0000003616 [ncp.at] TRACE: < OK
0000003616 [ncp.client] TRACE: NCP ready to accept AT commands
0000003617 [ncp.at] TRACE: > AT
0000003619 [ncp.at] TRACE: < OK
0000003620 [ncp.at] TRACE: > ATI9
0000003622 [ncp.at] TRACE: < 03.15,A00.01
0000003622 [ncp.at] TRACE: < OK
0000003622 [ncp.client] TRACE: App firmware: 1
0000003623 [ncp.at] TRACE: > AT+UGPIOC?
0000003626 [ncp.at] TRACE: < +UGPIOC:
0000003626 [ncp.at] TRACE: < 16,255
0000003627 [ncp.at] TRACE: < 19,255
0000003627 [ncp.at] TRACE: < 23,0
0000003628 [ncp.at] TRACE: < 24,255
0000003628 [ncp.at] TRACE: < 25,255
0000003629 [ncp.at] TRACE: < 33,255
0000003629 [ncp.at] TRACE: < 42,255
0000003630 [ncp.at] TRACE: < 46,255
0000003630 [ncp.at] TRACE: < OK
0000003631 [ncp.at] TRACE: > AT+UGPIOR=23
0000003634 [ncp.at] TRACE: < +UGPIOR: 23,1
0000003634 [ncp.at] TRACE: < OK
0000003635 [ncp.client] INFO: Using internal SIM card
0000003635 [ncp.at] TRACE: > AT+CPIN?
0000003638 [ncp.at] TRACE: < ERROR
0000004637 [ncp.at] TRACE: > AT+CPIN?
0000004640 [ncp.at] TRACE: < +CPIN: READY
0000004640 [ncp.at] TRACE: < OK
0000004641 [ncp.at] TRACE: > AT+CCID
0000005035 [ncp.at] TRACE: < +CCID: 89883070000037636055
0000005035 [ncp.at] TRACE: < OK
0000005036 [ncp.at] TRACE: > AT+IFC?
0000005039 [ncp.at] TRACE: < +IFC: 2,2
0000005039 [ncp.at] TRACE: < OK
0000005040 [ncp.at] TRACE: > AT+IFC=2,2
0000005042 [ncp.at] TRACE: < OK
0000005042 [ncp.at] TRACE: > AT
0000005044 [ncp.at] TRACE: < OK
0000005045 [ncp.at] TRACE: > AT+IPR=460800
0000005048 [ncp.at] TRACE: < OK
0000006048 [ncp.at] TRACE: > AT
0000006051 [ncp.at] TRACE: < OK
0000006051 [ncp.at] TRACE: > AT+CCID
0000006092 [ncp.at] TRACE: < +CCID: 89883070000037636055
0000006092 [ncp.at] TRACE: < OK
0000006093 [ncp.at] TRACE: > AT+UMNOPROF?
0000006096 [ncp.at] TRACE: < +UMNOPROF: 100
0000006097 [ncp.at] TRACE: < OK
0000006097 [ncp.at] TRACE: > AT+UBANDMASK?
0000006100 [ncp.at] TRACE: < +UBANDMASK: 0,6170,0
0000006101 [ncp.at] TRACE: < OK
0000006101 [ncp.at] TRACE: > AT+COPS=3,2
0000006104 [ncp.at] TRACE: < OK
0000006104 [ncp.at] TRACE: > AT+CGEREP=1,0
0000006107 [ncp.at] TRACE: < OK
0000006107 [ncp.at] TRACE: > AT+URAT?
0000006110 [ncp.at] TRACE: < +URAT: 7
0000006110 [ncp.at] TRACE: < OK
0000006110 [ncp.at] TRACE: > AT+CPSMS?
0000006113 [ncp.at] TRACE: < +CPSMS: 0,,,"00010011","00000011"
0000006114 [ncp.at] TRACE: < OK
0000006114 [ncp.at] TRACE: > AT+CEDRXS?
0000006117 [ncp.at] TRACE: < +CEDRXS: 4,"0000"
0000006118 [ncp.at] TRACE: < OK
0000006118 [ncp.at] TRACE: > AT+UPSV?
0000006121 [ncp.at] TRACE: < +UPSV: 0
0000006121 [ncp.at] TRACE: < OK
0000006121 [ncp.at] TRACE: > AT+UPSV=1
0000006124 [ncp.at] TRACE: < OK
0000006125 [ncp.at] TRACE: > AT+CMUX=0,0,,1509,,,,,
0000006130 [ncp.at] TRACE: < OK
0000006130 [mux] INFO: Starting GSM07.10 muxer
0000006131 [mux] INFO: Opening mux channel 0
0000006131 [mux] INFO: GSM07.10 muxer thread started
0000006134 [mux] INFO: Opening mux channel 1
0000006138 [ncp.at] TRACE: > AT
0000006142 [ncp.at] TRACE: < OK
0000006142 [ncp.client] TRACE: NCP state changed: 1
0000006142 [net.pppncp] TRACE: NCP event 1
0000006143 [net.ppp.client] TRACE: PPP thread event ADM_UP data=0
0000006144 [net.ppp.client] TRACE: State NONE -> READY
0000006147 [ncp.at] TRACE: > AT
0000006149 [ncp.at] TRACE: < OK
0000006150 [ncp.at] TRACE: > AT+CFUN?
0000006153 [ncp.at] TRACE: < +CFUN: 1,7
0000006154 [ncp.at] TRACE: < OK
0000006155 [ncp.at] TRACE: > AT+CCID
0000006182 [ncp.at] TRACE: < +CCID: 89883070000037636055
0000006183 [ncp.at] TRACE: < OK
0000006184 [ncp.at] TRACE: > AT+CGDCONT?
0000006189 [ncp.at] TRACE: < +CGDCONT: 1,"IP","super","0.0.0.0",0,0,0,2,0,0,0,0,0,0,0
0000006190 [ncp.at] TRACE: < OK
0000006191 [ncp.at] TRACE: > AT+CFUN?
0000006195 [ncp.at] TRACE: < +CFUN: 1,7
0000006195 [ncp.at] TRACE: < OK
0000006196 [ncp.at] TRACE: > AT+CEREG=2
0000006199 [ncp.at] TRACE: < OK
0000006200 [ncp.client] TRACE: NCP connection state changed: 1
0000006200 [net.pppncp] TRACE: NCP event 2
0000006200 [net.pppncp] TRACE: State changed event: 1
0000006201 [net.ppp.client] TRACE: PPP thread event LOWER_DOWN data=0
0000006201 [ncp.at] TRACE: > AT+COPS?
0000006205 [ncp.at] TRACE: < +COPS: 0
0000006205 [ncp.at] TRACE: < OK
0000006206 [ncp.at] TRACE: > AT+CEREG?
0000006209 [ncp.at] TRACE: < +CEREG: 2,0
0000006210 [ncp.at] TRACE: < OK
0000007810 [ncp.at] TRACE: < +CEREG: 5,"a9fe","01c24e0c",7
0000007811 [ncp.client] TRACE: NCP connection state changed: 2
0000007812 [mux] INFO: Opening mux channel 2
0000009046 [net.pppncp] TRACE: NCP event 100
0000009047 [net.pppncp] TRACE: New auth info
0000009049 [net.pppncp] TRACE: NCP event 2
0000009049 [net.pppncp] TRACE: State changed event: 2
0000009051 [net.ppp.client] TRACE: PPP thread event LOWER_UP data=0
0000009051 [net.ppp.client] TRACE: State READY -> CONNECT
0000009050 [ncp.at] TRACE: > AT+CIMI
0000009054 [net.ppp.client] TRACE: State CONNECT -> CONNECTING
0000009076 [ncp.at] TRACE: < 234104869459302
0000009077 [ncp.at] TRACE: < OK
0000009078 [ncp.at] TRACE: > AT
0000009080 [ncp.at] TRACE: < OK
0000009081 [ncp.at] TRACE: > AT+CGATT?
0000009085 [ncp.at] TRACE: < +CGATT: 1
0000009085 [ncp.at] TRACE: < OK
0000010087 [ncp.at] TRACE: > AT
0000010090 [ncp.at] TRACE: < OK
0000010091 [ncp.at] TRACE: > AT+UPORTFWD=100,1
0000010095 [ncp.at] TRACE: < +UPORTFWD: 100,1
0000010095 [ncp.at] TRACE: < OK
0000010096 [ncp.at] TRACE: > ATD*99***1#
0000010102 [ncp.at] TRACE: < CONNECT
0000010103 [net.ppp.client] TRACE: PPP phase -> Initialize
0000010104 [net.ppp.client] TRACE: PPP phase -> Establish
0000010105 [lwip.ppp] TRACE: sent [LCP ConfReq id=0x1 <asyncmap 0x0> <magic 0x58521a75> <pcomp> <accomp>]
0000010113 [lwip.ppp] TRACE: rcvd [LCP ConfAck id=0x1 <asyncmap 0x0> <magic 0x58521a75> <pcomp> <accomp>]
0000013402 [lwip.ppp] TRACE: rcvd [LCP ConfReq id=0x1 <asyncmap 0x0> <mru 1360> <auth pap> <accomp> <pcomp>]
0000013403 [lwip.ppp] TRACE: sent [LCP ConfAck id=0x1 <asyncmap 0x0> <mru 1360> <auth pap> <accomp> <pcomp>]
0000013405 [lwip.ppp] TRACE: sent [LCP EchoReq id=0x0 magic=0x58521a75]
0000013405 [net.ppp.client] TRACE: PPP phase -> Authenticate
0000013406 [lwip.ppp] TRACE: sent [PAP AuthReq id=0x1 user="" password=""]
0000013415 [lwip.ppp] TRACE: rcvd [LCP EchoRep id=0x0 magic=0x0]
0000013418 [lwip.ppp] TRACE: rcvd [PAP AuthAck id=0x1 "Login successful."]
0000013418 [net.ppp.client] TRACE: PPP phase -> Network
0000013420 [lwip.ppp] TRACE: sent [IPCP ConfReq id=0x1 <addr 0.0.0.0> <msdns1 8.8.8.8> <msdns2 8.8.4.4>]
0000013421 [lwip.ppp] TRACE: rcvd [IPCP ConfReq id=0x0 <addr 192.168.201.2>]
0000013422 [lwip.ppp] TRACE: sent [IPCP ConfNak id=0x0 <addr 192.168.201.2>]
0000013432 [lwip.ppp] TRACE: rcvd [IPCP ConfNak id=0x1 <addr 192.168.201.1> <msdns1 8.8.4.4> <msdns2 8.8.8.8>]
0000013433 [lwip.ppp] TRACE: sent [IPCP ConfReq id=0x2 <addr 192.168.201.1> <msdns1 8.8.4.4> <msdns2 8.8.8.8>]
0000013435 [lwip.ppp] TRACE: rcvd [IPCP ConfReq id=0x1 <addr 192.168.201.2>]
0000013435 [lwip.ppp] TRACE: sent [IPCP ConfAck id=0x1 <addr 192.168.201.2>]
0000013443 [lwip.ppp] TRACE: rcvd [IPCP ConfAck id=0x2 <addr 192.168.201.1> <msdns1 8.8.4.4> <msdns2 8.8.8.8>]
0000013447 [system.nm] INFO: State changed: IFACE_UP -> IFACE_LINK_UP
0000013448 [system.nm] INFO: State changed: IFACE_LINK_UP -> IP_CONFIGURED
0000013449 [net.ppp.client] TRACE: PPP phase -> Running
0000013448 [net.ppp.client] TRACE: PPP thread event UP data=0
0000013450 [net.ppp.client] TRACE: State CONNECTING -> CONNECTED
0000013452 [net.pppncp] TRACE: Negotiated MTU: 1360
0000013453 [system] INFO: Cloud: connecting
0000013454 [system] WARN: Failed to load session data from persistent storage
0000013823 [system] INFO: Cloud socket connected
0000013823 [comm.protocol.handshake] INFO: Establish secure connection
0000013826 [comm.dtls] INFO: (CMPL,RENEG,NO_SESS,ERR) restoreStatus=2
0000017920 [comm.protocol.handshake] INFO: Sending HELLO message
0000017921 [comm.coap] TRACE: Sending CoAP message
0000017921 [comm.coap] TRACE: CON POST /h size=39 token= id=1
0000018035 [comm.coap] TRACE: Received CoAP message
0000018035 [comm.coap] TRACE: ACK 0.00  size=4 token= id=1
0000018036 [comm.protocol.handshake] INFO: Handshake completed
0000018036 [comm.protocol.handshake] TRACE: Updating cached session parameters
0000018036 [comm.dtls] INFO: session cmd (CLS,DIS,MOV,LOD,SAV): 4
0000018038 [comm.dtls] INFO: session cmd (CLS,DIS,MOV,LOD,SAV): 3
0000018223 [ncp.at] TRACE: > AT+CFUN?
0000018227 [ncp.at] TRACE: < +CFUN: 1,7
0000018227 [ncp.at] TRACE: < OK
0000018228 [ncp.at] TRACE: > AT+CCID
0000018275 [ncp.at] TRACE: < +CCID: 89883070000037636055
0000018275 [ncp.at] TRACE: < OK
0000018276 [ncp.at] TRACE: > AT+CGSN
0000018280 [ncp.at] TRACE: < 351457833663245
0000018281 [ncp.at] TRACE: < OK
0000018281 [ncp.at] TRACE: > ATI9
0000018285 [ncp.at] TRACE: < 03.15,A00.01
0000018285 [ncp.at] TRACE: < OK
0000018287 [comm.coap] TRACE: Sending CoAP message
0000018288 [comm.coap] TRACE: CON POST /d?\x01 size=220 token=d6 id=2
0000018292 [comm.coap] TRACE: Sending CoAP message
0000018292 [comm.coap] TRACE: CON POST /E/spark/device/last_reset size=42 token= id=3
0000018294 [comm.coap] TRACE: Sending CoAP message
0000018294 [comm.coap] TRACE: CON POST /E/particle/device/updates/enabled size=44 token= id=4
0000018296 [comm.coap] TRACE: Sending CoAP message
0000018296 [comm.coap] TRACE: CON POST /E/particle/device/updates/forced size=44 token= id=5
0000018298 [comm.coap] TRACE: Sending CoAP message
0000018298 [comm.coap] TRACE: CON GET /t size=7 token=d7 id=6
0000018458 [comm.coap] TRACE: Received CoAP message
0000018458 [comm.coap] TRACE: ACK 0.00  size=5 token=d6 id=2
0000018459 [comm.protocol] TRACE: Updating system DESCRIBE checksum
0000018459 [comm.dtls] INFO: session cmd (CLS,DIS,MOV,LOD,SAV): 4
0000018660 [ncp.at] TRACE: > AT+CFUN?
0000018663 [ncp.at] TRACE: < +CFUN: 1,7
0000018663 [ncp.at] TRACE: < OK
0000018664 [ncp.at] TRACE: > AT+CCID
0000018689 [ncp.at] TRACE: < +CCID: 89883070000037636055
0000018689 [ncp.at] TRACE: < OK
0000018690 [ncp.at] TRACE: > AT+CGSN
0000018693 [ncp.at] TRACE: < 351457833663245
0000018694 [ncp.at] TRACE: < OK
0000018694 [ncp.at] TRACE: > ATI9
0000018698 [ncp.at] TRACE: < 03.15,A00.01
0000018698 [ncp.at] TRACE: < OK
0000018699 [comm.dtls] INFO: session cmd (CLS,DIS,MOV,LOD,SAV): 3
0000018700 [comm.coap] TRACE: Received CoAP message
0000018700 [comm.coap] TRACE: ACK 0.00  size=4 token= id=3
0000018701 [comm.coap] TRACE: Received CoAP message
0000018701 [comm.coap] TRACE: ACK 0.00  size=4 token= id=4
0000018702 [comm.coap] TRACE: Received CoAP message
0000018703 [comm.coap] TRACE: ACK 2.05  size=10 token=d7 id=6
0000018703 [comm.protocol] INFO: Received TIME response: 1734649791
0000018704 [comm.coap] TRACE: Received CoAP message
0000018705 [comm.coap] TRACE: ACK 0.00  size=4 token= id=5
0000018706 [system] INFO: Cloud connected
0000018706 [app] INFO: Tinker app setup starting
0000018707 [app] INFO: Tinker app setup complete
0000018707 [comm.coap] TRACE: Sending CoAP message
0000018708 [comm.coap] TRACE: CON POST /d?\x02 size=80 token=d8 id=7
0000018709 [comm.protocol] INFO: Sending subscriptions
0000018710 [comm.coap] TRACE: Sending CoAP message
0000018710 [comm.coap] TRACE: CON GET /e/particle?u size=17 token= id=8
0000018712 [comm.coap] TRACE: Sending CoAP message
0000018712 [comm.coap] TRACE: CON GET /e/spark?u size=14 token= id=9
0000018859 [comm.coap] TRACE: Received CoAP message
0000018859 [comm.coap] TRACE: ACK 0.00  size=5 token=d8 id=7
0000018860 [comm.protocol] TRACE: Updating application DESCRIBE checksum
0000018860 [comm.dtls] INFO: session cmd (CLS,DIS,MOV,LOD,SAV): 4
0000018861 [comm.dtls] INFO: session cmd (CLS,DIS,MOV,LOD,SAV): 3
0000018871 [comm.coap] TRACE: Received CoAP message
0000018871 [comm.coap] TRACE: ACK 0.00  size=4 token= id=8
0000018882 [comm.coap] TRACE: Received CoAP message
0000018882 [comm.coap] TRACE: ACK 0.00  size=4 token= id=9
0000018883 [comm.protocol] TRACE: Updating subscriptions checksum
0000018883 [comm.dtls] INFO: session cmd (CLS,DIS,MOV,LOD,SAV): 4
0000018884 [comm.dtls] INFO: session cmd (CLS,DIS,MOV,LOD,SAV): 3
0000019498 [comm.coap] TRACE: Received CoAP message
0000019499 [comm.coap] TRACE: CON POST /E/particle/device/updates/pending size=47 token=01 id=64123
0000019499 [comm.coap] TRACE: Sending CoAP message
0000019500 [comm.coap] TRACE: ACK 0.00  size=4 token= id=64123
0000020082 [comm.coap] TRACE: Received CoAP message
0000020083 [comm.coap] TRACE: CON GET /d?\x04 size=9 token=02 id=64124
0000020083 [comm.protocol] INFO: Received DESCRIBE request; flags: 0x04
0000020084 [comm.coap] TRACE: Sending CoAP message
0000020084 [comm.coap] TRACE: ACK 0.00  size=4 token= id=64124
0000020086 [ncp.at] TRACE: > AT+COPS=3,2
0000020092 [ncp.at] TRACE: < OK
0000020093 [ncp.at] TRACE: > AT+COPS?
0000020096 [ncp.at] TRACE: < +COPS: 0,2,"310260",7
0000020097 [ncp.at] TRACE: < OK
0000020098 [ncp.at] TRACE: > AT+UCGED?
0000020584 [ncp.at] TRACE: < +UCGED: 2
0000020585 [ncp.at] TRACE: < 6,4,310,260
0000020585 [ncp.at] TRACE: < 676,2,25,25,a9fe,1c24e0c,67,d2eec14b,8003,21,23,19,2.31,3,255,255,22,23,23,0,255,255,80
0000020587 [ncp.at] TRACE: < OK
0000020588 [ncp.at] TRACE: > AT+COPS=3,2
0000020592 [ncp.at] TRACE: < OK
0000020592 [ncp.at] TRACE: > AT+COPS?
0000020596 [ncp.at] TRACE: < +COPS: 0,2,"310260",7
0000020597 [ncp.at] TRACE: < OK
0000020598 [ncp.at] TRACE: > AT+CEREG?
0000020601 [ncp.at] TRACE: < +CEREG: 2,5,"a9fe","01c24e0c",7
0000020602 [ncp.at] TRACE: < OK
0000020602 [comm.coap] TRACE: Sending CoAP message
0000020603 [comm.coap] TRACE: CON 2.05  size=199 token=02 id=10
0000020786 [comm.coap] TRACE: Received CoAP message
0000020787 [comm.coap] TRACE: ACK 0.00  size=4 token= id=10
0000372540 [comm.coap] TRACE: Received CoAP message
0000372541 [comm.coap] TRACE: CON POST /f/digitalRead? size=20 token=03 id=64125
0000372541 [comm.coap] TRACE: Sending CoAP message
0000372542 [comm.coap] TRACE: ACK 0.00  size=4 token= id=64125
0000372543 [app] INFO: digitalRead command received:
0000372544 [comm.coap] TRACE: Sending CoAP message
0000372544 [comm.coap] TRACE: CON 2.04  size=10 token=03 id=11
0000372700 [comm.coap] TRACE: Received CoAP message
0000372700 [comm.coap] TRACE: ACK 0.00  size=4 token= id=11
This is the full program that is running:
#include "Particle.h"

// Serial logger for debugging via TX/RX pins
SerialLogHandler logHandler(LOG_LEVEL_ALL);

int tinkerDigitalWrite(String command);
int tinkerDigitalRead(String command);
int tinkerAnalogWrite(String command);
int tinkerAnalogRead(String command);

void setup() {
    // Initialize Serial1 for TX/RX debugging
    Serial.begin(9600);
    Log.info("Tinker app setup starting");

    // Register Particle functions for Tinker app
    Particle.function("digitalWrite", tinkerDigitalWrite);
    Particle.function("digitalRead", tinkerDigitalRead);
    Particle.function("analogWrite", tinkerAnalogWrite);
    Particle.function("analogRead", tinkerAnalogRead);

    Log.info("Tinker app setup complete");
}

void loop() {
    // Log something periodically for debugging
    // Log.info("Tinker app running");
    // delay(1); // Adjust as needed for debugging
}

// Tinker app functions
int tinkerDigitalWrite(String command) {
    Log.info("digitalWrite command received: %s", command.c_str());

    bool value = 0;
    int pin = command.charAt(1) - '0';
    String valueStr = command.substring(3);

    if (valueStr == "HIGH") value = 1;
    else if (valueStr == "LOW") value = 0;
    else return -2; // Error: Invalid value

    if (command.startsWith("D") && (pin >= 0 && pin <= 7)) {
        pinMode(pin, OUTPUT);
        digitalWrite(pin, value);
        return 1;
    } else {
        return -1; // Error: Invalid pin
    }
}

int tinkerDigitalRead(String command) {
    Log.info("digitalRead command received: %s", command.c_str());

    int pin = command.charAt(1) - '0';

    if (command.startsWith("D") && (pin >= 0 && pin <= 7)) {
        pinMode(pin, INPUT_PULLDOWN);
        return digitalRead(pin);
    } else {
        return -1; // Error: Invalid pin
    }
}

int tinkerAnalogWrite(String command) {
    Log.info("analogWrite command received: %s", command.c_str());

    int pin = command.charAt(1) - '0';
    int value = command.substring(3).toInt();

    if (command.startsWith("D") && (pin >= 0 && pin <= 7)) {
        pinMode(pin, OUTPUT);
        analogWrite(pin, value);
        return 1;
    } else {
        return -1; // Error: Invalid pin
    }
}

int tinkerAnalogRead(String command) {
    Log.info("analogRead command received: %s", command.c_str());

    int pin = command.charAt(1) - '0';

    if (command.startsWith("A") && (pin >= 0 && pin <= 5)) {
        pinMode(pin, INPUT);
        return analogRead(pin);
    } else {
        return -1; // Error: Invalid pin
    }
}