I don’t use Particle workbench, but I use plain VScode with my own makefiles.
I figured out how to do hardware debugging properly, so I thought I would share.
This is for vscode and the cortex-debug extension.
With the right config and by loading system elf files in the gdb init, you can really almost everything that happens on the photon. Closed source Wiced part excluded.
- It works without a monolithic build. Do you have to flash SWD enabled system layers.
- It works multithreaded, you can see the system threads too.
make clean all program-dfu PLATFORM=p1 PARTICLE_DEVELOP=y USE_SWD=y
This will flash an SWD enabled system layer.
Next build and flash your application with SWD:
make clean all program-dfu PLATFORM=p1 PARTICLE_DEVELOP=y USE_SWD=y
Create this gdb init file (adjust paths relative to your build dir) and save as system.gdbinit
define add-symbol-file-auto
  # Parse .text address to temp file
  shell echo set \$text_address=$(readelf -WS $arg0 | grep .text | awk '{ print "0x"$5 }') >/tmp/temp_gdb_text_address.txt

  # Source .text address
  source /tmp/temp_gdb_text_address.txt

  #  Clean tempfile
  shell rm -f /tmp/temp_gdb_text_address.txt

  # Load symbol table
  add-symbol-file $arg0 $text_address
end

add-symbol-file-auto platform/spark/device-os/build/target/system-part1/platform-8-m/system-part1.elf
add-symbol-file-auto platform/spark/device-os/build/target/system-part2/platform-8-m/system-part2.elf
In vscode, use extension cortex-debug and use this launch config in ‘launch.json’, adjust paths for your system.
{
      "name": "brewblox p1 openocd debug",
      "type": "cortex-debug",
      "request": "attach",
      "servertype": "openocd",
      "cwd": "${workspaceRoot}",
      "executable": "./build/target/brewblox-p1/brewblox.elf",
      "debuggerArgs": [
        "-command=./tools/system.gdbinit",
      ],
      "rtos": "FreeRTOS",
      "device": "STM32F205RG",
      "configFiles": [
        "/usr/local/share/openocd/scripts/interface/stlink-v2.cfg",
        "/usr/local/share/openocd/scripts/target/stm32f2x.cfg"
      ],
      "armToolchainPath": "/home/elco/source/gcc-arm-none-eabi-5_3-2016q1/bin",
      //      "showDevDebugOutput": true,
      "svdFile": "./tools/STM32F215.svd"
    },
svd file is optional. This is for an stlink-v2 with SWD. Ensure that you are not using the SWD pins in your program (D6 and D7)
Hardfaults
To debug a hardfault, set a breakpoint in hal/src/stm32f2xx/core_hal_stm32f2xx.c.
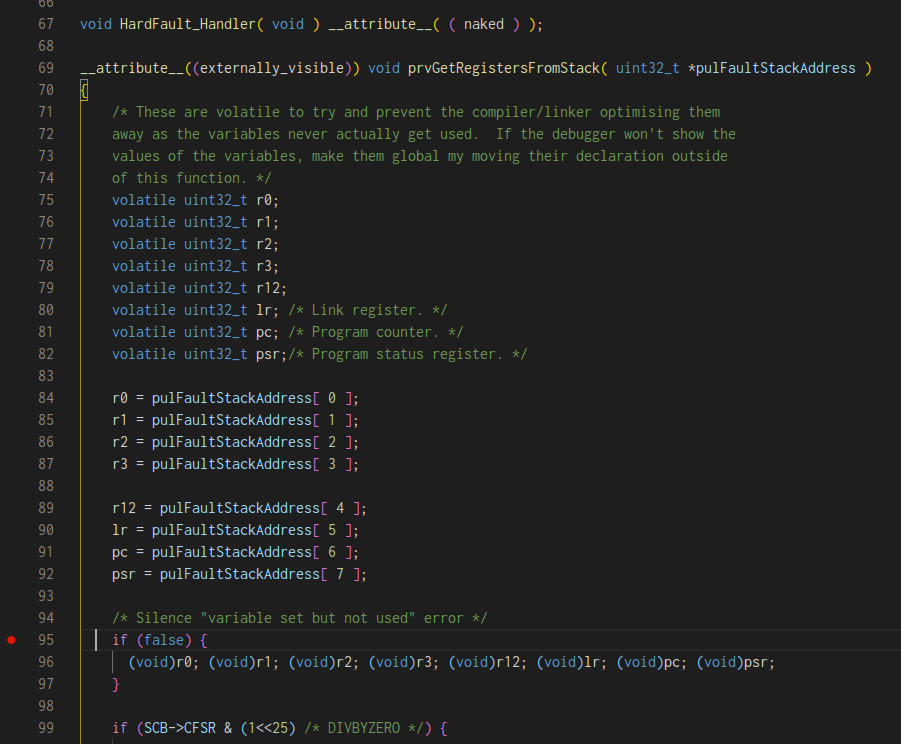
You can trace where the hardfault occurred from those registers.
If you convert the value at pc and lr to hex (use google), you can find the addresses in the lst file that is in the same directory as your firmware. Search that file for the address to find the exact instruction that triggered the hardfault.
To quickly inspect what is on a certain memory address, type into the debug console:
x <your address>.
For panic codes, set a breakpoint in panic.c.
I hope this helps others to find some really hard bugs.
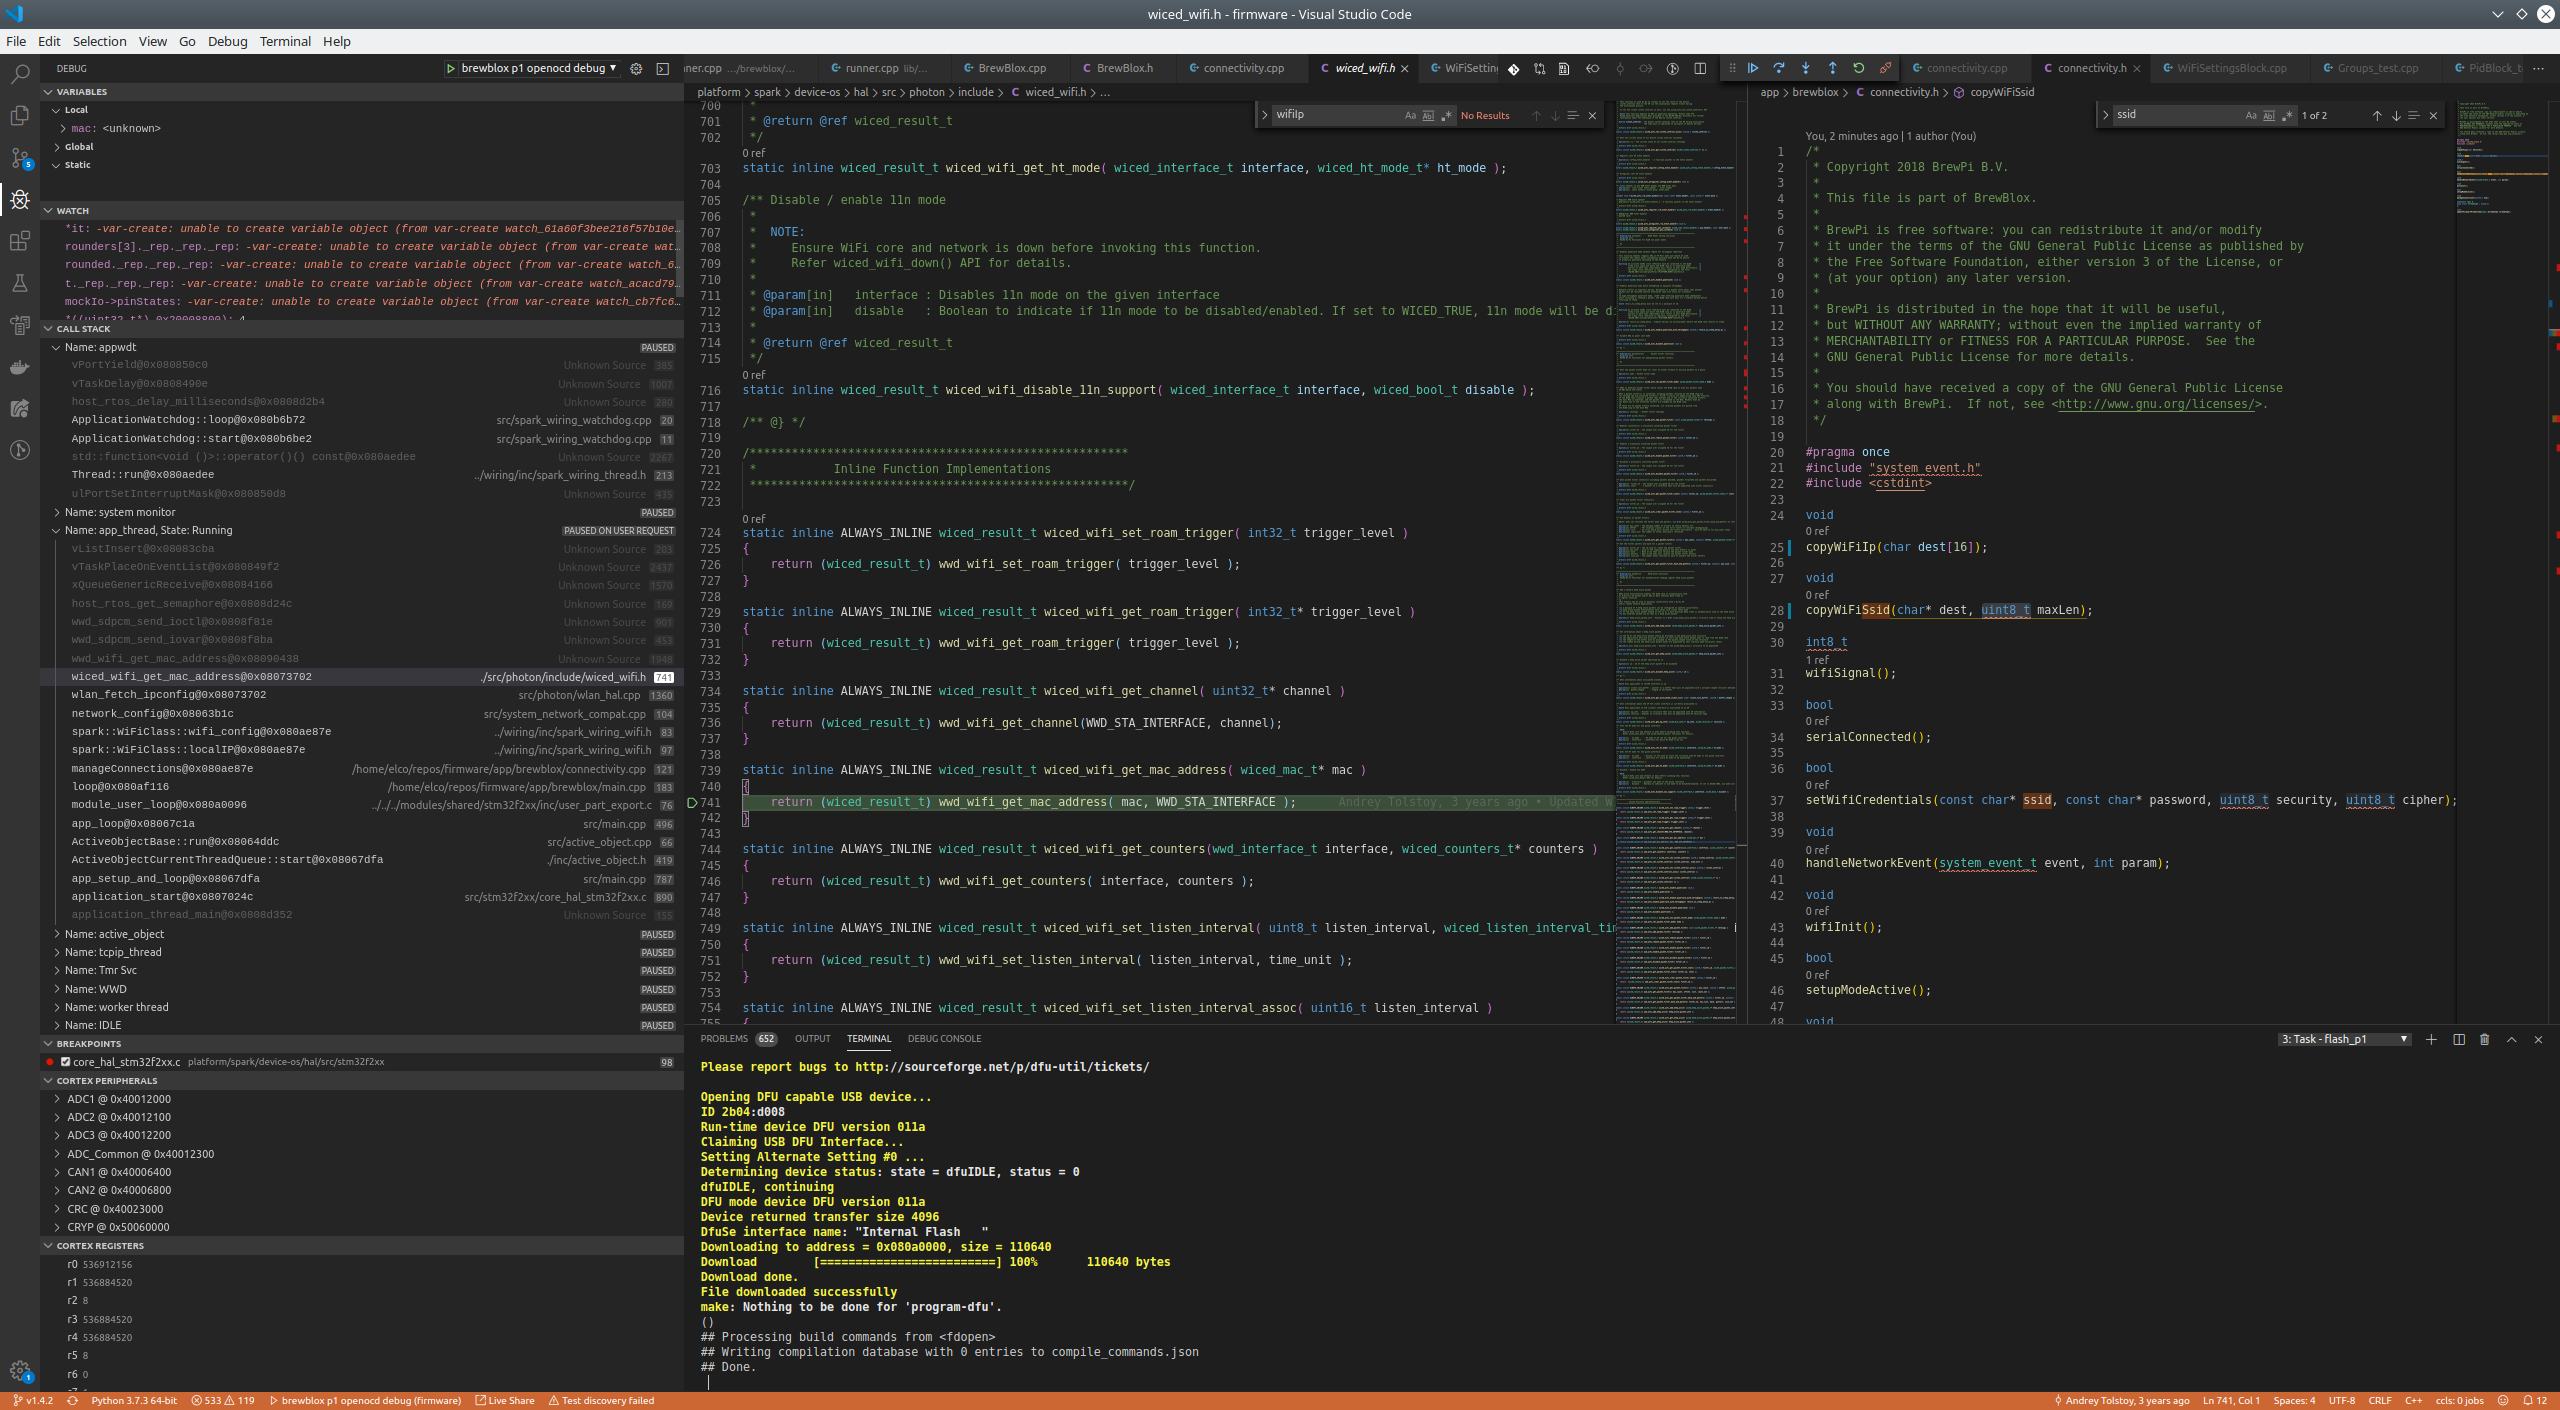
Screenshot: