I've been chasing a HardFault for some time and recently setup hardware on my bench and have caught it twice, which I described below.
My program is currently halted within Particle's prvGetRegistersFromStack(), so I welcome any input/ideas, especially from the FW guru's at Particle. Happy to have discussions here or elsewhere.
TLDR findings:
- Hit breakpoint on
HardFault_Handler(): fault indicated inapp_threadbut theIMPRECISERRbit of BusFault Status Register is set (thus LR and PC don't indicate exact fault location). Backtrace reported fault down in FreeRTOS code (taken with grain of salt because IMPRECISERR=1). - I set DISDEFWBUF bit of the ACTLR reg (disables write buffering, should force most IMPRECISE errors to be PRECISE) and reset the system.
- 24h later: Hit breakpoint
HardFault_Handler(): same region ofapp_threadstill showing fault in FreeRTOS code, but this time withPRECISERRandBFARVALID, so I trust the backtrace more. - Last frame of my code called
delay(1). - Debugger indicates fault occured in
uxListRemove( ListItem_t * const pxItemToRemove )of list.c - The call stack for one of my threads is incorrect when halted on the breakpoint, and appears as a duplicate of the
app_thread. When I pause program execution manually, it shows up as expected.
Background:
- Borons, DeviceOS v6.2.1
- Faults always occur, sometimes after 5 mins, sometimes after 4 days, but this occurs on every Boron that has my recent firmware.
- I have four user threads:
- app_thread (process Particle events, measure stuff (I2C ADCs), control stuff (I2C GPIO expanders)
- PublishQueueAsyncRK (@rickkas7's async pub event queue lib)
- ThreadedSDInter (uses
os_queueto do async SD card writes) - appwdt (set with 1024 byte stack, dropped in long ago as a debugging aid along with the HW WDT)
First debugger catch (yesterday)
- Set a breakpoint on
HardFault_Handler, caught it ~19.5h later - Backtrace is below
- Info from the Configurable Fault Status Registers
// Entire CFSR
print/x *(uint32_t *)0xE000ED28
$15 = 0x400

// OK... so flag is in BusFault Status Register
print/x *(uint8_t *)0xE000ED29
$17 = 0x4
- This is the
IMPRECISERRflag of the BFSR, indicating the hardware cannot tell exactly where the fault occurred (likely because it occurred on a store operation which occurs asynchronously from program execution). See the excellent blog post at Memfault on debugging these errors. - So the code likely advanced, but not too far before before it was halted, so we're in the neighborhood.
- Checked stack usage of
app_threadwith the xRTOS viewer (I assume this can be trusted?), seems fine: 1140 bytes used, 3440 bytes peak - In previous efforts I instrumented (and ruled out) heap problems even though I avoid dynamic allocation like the plague. (I'll admit to rare usage of
std::string). Devices typically have ~47k free, with largest contiguous block 46.6k after running 17h. Heap problem unlikely.
Backtrace from first catch (some function/filenames changed/redacted):
bt
#0  prvGetRegistersFromStack (pulFaultStackAddress=0x2003eef8) at ../../../hal/./src/nRF52840/core_hal.c:123
#1  <signal handler called>
#2  uxListRemove (pxItemToRemove=pxItemToRemove@entry=0x20027bf0) at ./freertos/FreeRTOS/Source/list.c:183
#3  0x00096b5e in xTaskIncrementTick () at ./freertos/FreeRTOS/Source/tasks.c:2883
#4  0x0007d16c in SysTick_Handler () at ../../../third_party/nrf5_sdk/./nrf5_sdk/external/freertos/portable/CMSIS/nrf52/port_cmsis_systick.c:75
#5  0x00049fde in SysTickChain () at ../../../hal/./src/nRF52840/core_hal.c:219
#6  <signal handler called>
#7  nrf_rtc_event_pending (event=NRF_RTC_EVENT_OVERFLOW, p_reg=0x40024000) at ../../../hal/../third_party/nrf5_sdk/nrf5_sdk/modules/nrfx/hal/nrf_rtc.h:353
#8  (anonymous namespace)::getOverflowCounter () at ../../../hal/./src/nRF52840/timer_hal.cpp:143
#9  (anonymous namespace)::getOverflowCounter () at ../../../hal/./src/nRF52840/timer_hal.cpp:135
#10 0x0005bb6c in (anonymous namespace)::getCurrentTimeWithTicks (baseOffset=<synthetic pointer>, micros=<synthetic pointer>, ticks=<synthetic pointer>) at ../../../hal/./src/nRF52840/timer_hal.cpp:201
#11 hal_timer_micros (reserved=reserved@entry=0x0) at ../../../hal/./src/nRF52840/timer_hal.cpp:350
#12 0x0005bc64 in HAL_Timer_Get_Micro_Seconds () at ../../../hal/./src/nRF52840/timer_hal.cpp:361
#13 0x0005f376 in hal_i2c_request_ex (i2c=<optimized out>, config=0x20016a38, reserved=<optimized out>) at ../../../hal/./src/nRF52840/i2c_hal.cpp:501
#14 0x000c7bd8 in TwoWire::requestFrom (this=<optimized out>, transfer=...) at src/spark_wiring_i2c.cpp:96
#15 0x000c7c00 in TwoWire::requestFrom (this=<optimized out>, address=<optimized out>, quantity=quantity@entry=1, sendStop=sendStop@entry=1 '\001') at ./inc/spark_wiring_i2c.h:63
#16 0x000c7c0c in TwoWire::requestFrom (this=<optimized out>, address=<optimized out>, quantity=quantity@entry=1) at src/spark_wiring_i2c.cpp:91
#17 0x000be7cc in PCA9538::readI2CBuffer (this=this@entry=0x2003a4f0 <io>, dest=dest@entry=0x20016adf "", startRegister=<optimized out>, len=len@entry=1) at //////lib/pca9538/src/PCA9538.cpp:274
#18 0x000be8d2 in PCA9538::readI2CRegister (this=this@entry=0x2003a4f0 <io>, dest=dest@entry=0x20016adf "", registerAddress=registerAddress@entry=PCA9538_REGISTER_OUTPUT_PORT) at //////lib/pca9538/src/PCA9538.cpp:307
#19 0x000be9ee in PCA9538::write (this=this@entry=0x2003a4f0 <io>, pin=pin@entry=3 '\003', value=value@entry=1 '\001') at //////lib/pca9538/src/PCA9538.cpp:120
#20 0x000b8ad2 in bsp::PetWDT () at /home//////src/bsp.cpp:206
#21 bsp::PetHardwareWDT () at ///////src/bsp.cpp:198
#22 0x000c0e30 in std::function<void ()>::operator()() const (this=0x20027e1c) at /home/frost-lab1/.particle/toolchains/gcc-arm/10.2.1/arm-none-eabi/include/c++/10.2.1/bits/std_function.h:622
#23 methaniel::UartDriver::pet_wdt (this=this@entry=0x20027e00) at //////lib/methaniel_comms/src/methaniel_comms.cpp:428
#24 0x000c0ecc in methaniel::UartDriver::receive_response (buffer_size=<optimized out>, timeout_ms=1500, buffer=0x20028328 "\020", this=0x20027e00) at //////lib/methaniel_comms/src/methaniel_comms.cpp:353
I re-set the trap, but this time with store buffering disabled (per Memfault blog) in hopes of getting closer to the bug:
void setup()
// ...
  uint32_t* actlr = (uint32_t*)0xE000E008;
  // Set the DISDEFWBUF bit (bit 1)
  *actlr |= 0x02;
// ...
Second catch (this AM)
print/x *(uint32_t *)0xE000ED28
$1 = 0x8200

print/x *(uint8_t *)0xE000ED29
$3 = 0x82
Nice, this means the
PRECISERRbit ANDBFARVALIDbit
are set, so we should have caught the error, and the contents of$LRand$PCshould more accurately capture the location of the fault:
p/a *(uint32_t[8] *)$psp
$18 = {
0x20027bf8,
0xcc08080a,
0x6c2edb4,
0x1d3d11e3,
0xfa000000,
0x96b5f <xTaskIncrementTick+174>,
0x95bd4 <uxListRemove+6>,
0x21000000
}
Which matches with the call stack that's indicated in the left hand side of the debugger:
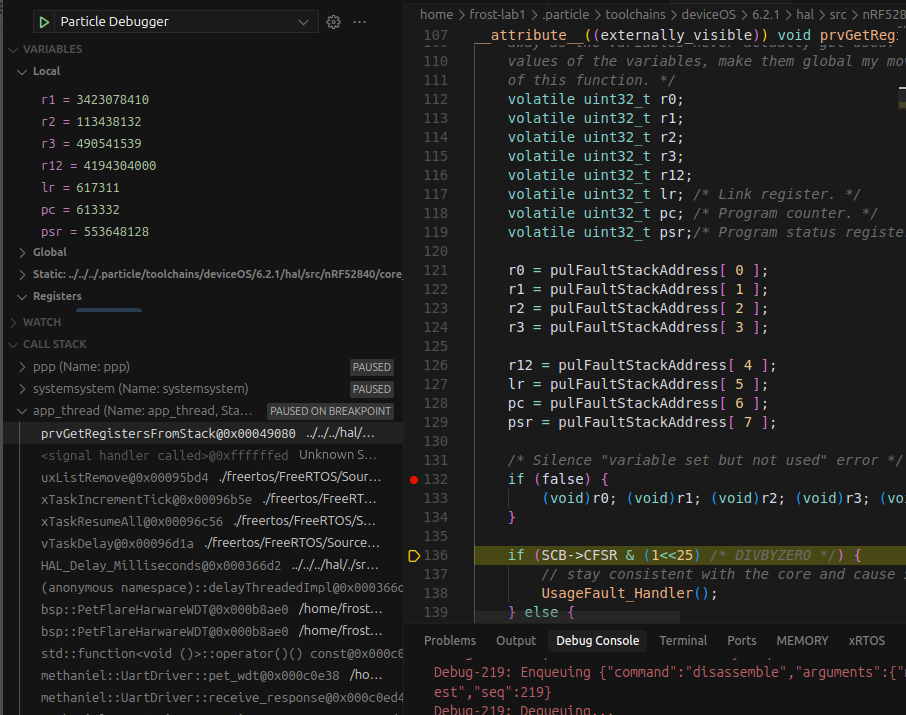
If we trust the output of the debugger and resultant the backtrace, the fault occurred when I called delay(1), in my watchdog service code, which looks like this:
void bsp::PetHardwareWDT() {
  if (enableWdt) {
    bsp::GetIoExpander().write(PIN_GPIO1_EXP, HIGH);
    delay(1);
    bsp::GetIoExpander().write(PIN_GPIO1_EXP, LOW);
  }
}
Here are some screenshots showing execution path after the call to delay(1)


Looking at the local variables at the offending location I see this:

If you're still with me, I will also note that the backtrace for one of my other threads is totally buggered up.
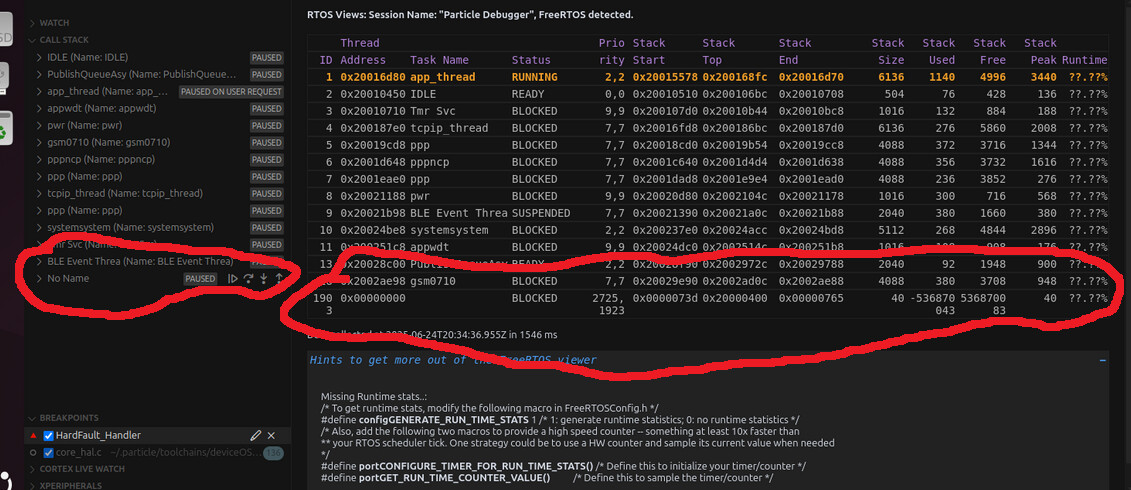
Note that the name of the thread is incorrect, the address of the thread pointer is wrong, and the thread's stack boundaries are nonsense.
Here's how it should appear (paused program execution manually, no fault condition):

Next steps
I am at the boundry of my debugging/GDB/FreeRTOS knowledge, and welcome any/all ideas.
- Should I believe that the hard fault is in fact occurring down in FreeRTOS as the debugger indicates? This would be surprising to me, as I naturally assume it would be on my side of the fence.
- What can I examine now, while things are halted, to gain additional information?
- The fact that one of my other threads doesn't have correct stack info is suspicious, but I lack the intuition if this is a red-hearing.
- I could disable that thread all together.. but because this bug is infrequent and unpredictable I would want to wait many times (3-10x maybe?) the longest duration uptime I've observed before having confidence the bug resides in that thread.